
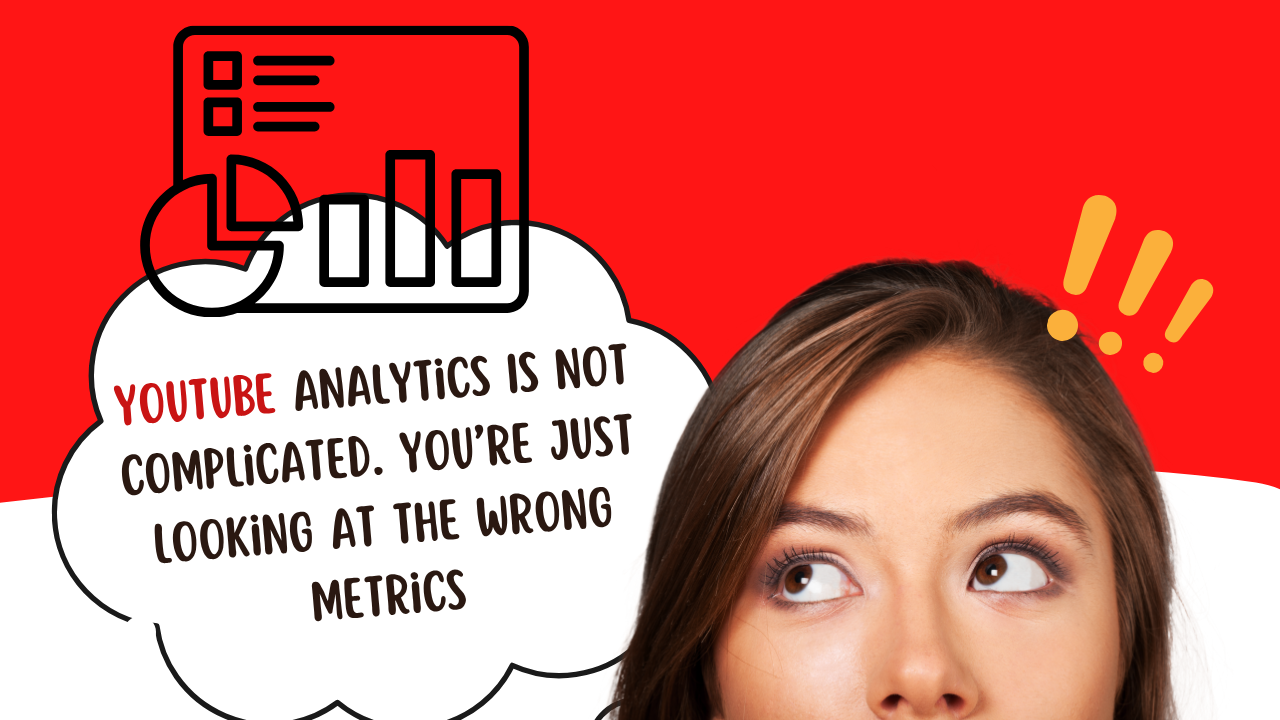
The Problem Is Not Data, It’s Interpretation
Most creators feel overwhelmed by YouTube Analytics. There are too many numbers, too many graphs, and too many tabs. It creates the impression that growth requires complex analysis or advanced technical understanding. But the issue is rarely complex. It is a misinterpretation. Creators are not struggling because the data is hard. They are struggling because they are focusing on the wrong signals and drawing the wrong conclusions from the right data. As a result, decisions are made based on surface-level understanding, and those decisions rarely lead to improvement. Analytics does not confuse growth. Misreading analytics does.
Views Are the Most Misleading Metric on the Dashboard
Views are the first number creators look at, and often the only ones they care about. It feels like the most direct indicator of performance. More views mean better performance; fewer views mean something went wrong. But views are not a metric you optimise. They are an outcome. When creators focus on views, they start reacting instead of understanding. A video performs well, and they try to replicate it without knowing why it worked. A video underperforms, and they abandon the idea without knowing what actually failed. This leads to inconsistent decisions. Views do not explain performance. They reflect it.
If you want to improve results, you need to understand what is driving those views, not just measure them.
The CTR Trap: When a “Good” Number Misleads You
Click-through rate is often treated as a success indicator. A high CTR feels like confirmation that the title and thumbnail are working. A low CTR feels like a packaging problem. But CTR without context is one of the most misleading signals in analytics. A high CTR does not always mean a video is performing well. It can also mean that the video is attracting strong initial interest but failing to hold attention. In such cases, viewers click but leave quickly. From the system’s perspective, this is a weak experience. On the other hand, a video with a moderate or even low CTR can still perform well if the viewers who do click stay for longer and engage deeply. CTR only explains the click. It says nothing about what happens after. This is where many creators go wrong. They optimise for clicks without verifying whether those clicks are translating into meaningful watch behaviour.
Why Retention Tells a More Honest Story
Retention is often seen as a secondary metric, but it is far more revealing than most creators realise. It shows how viewers are experiencing the video over time. Not just whether they clicked, but whether they stayed, where they lost interest, and how consistently the content held their attention. Unlike views or CTR, retention exposes friction.
If a large number of viewers leave early, it points to a mismatch between expectation and delivery. If retention drops at a specific moment, it highlights exactly where the content stopped working. If the curve stabilises, it shows where the video starts holding attention effectively. This makes retention one of the most actionable signals in analytics. It does not just measure performance; it shows where performance breaks. Yet many creators ignore it because it requires interpretation. It demands that you ask why something happened, not just observe that it did.
The Hidden Signal: Who Is Coming Back
Another metric that is often overlooked is the balance between new and returning viewers. Growth naturally brings new viewers, but sustained growth depends on returning ones. If a channel consistently attracts new viewers but fails to convert them into repeat viewers, it indicates a deeper issue. The content may be discoverable, but it is not building a connection.
Returning viewers reflect familiarity and trust. They suggest that the viewer found enough value to come back without being prompted. When this number remains low relative to new viewers, it often means that the channel lacks consistency in direction, identity, or value delivery. In simple terms, people are watching, but they are not staying connected.
The Mistake of Reading Metrics in Isolation
One of the most common analytical errors is looking at each metric independently. A video may have a strong CTR, but weak retention. Another may have average CTR but strong watch time. A third may perform well in search but not in browse. Each of these scenarios requires a different response. When metrics are viewed in isolation, they lead to incomplete conclusions. A creator may fix the thumbnail when the real issue is the opening. They may change the topic when the issue is an audience mismatch. They may abandon a format that is actually working for a specific segment. Analytics only becomes useful when metrics are read together, as part of a sequence. A click leads to a view. A view leads to watch time. Watch time contributes to session behaviour. Understanding how these stages connect is what turns data into insight.
Why Traffic Source Changes the Meaning of Data
The same video can perform differently depending on where the viewer comes from. A viewer from search behaves differently from a viewer from browse. Search-driven viewers usually have a clear intent. They are looking for something specific and are more likely to stay if that need is met. Browse-driven viewers are more passive. They decide quickly whether the video is worth their time. If a creator ignores this difference, they may misread performance. A video that performs well in search but poorly in browse is not necessarily weak. It may simply be better suited for intent-driven discovery. Similarly, a video that works well in browse but not in search may rely more on packaging than on specific query matching. Without considering the traffic source, analytics becomes misleading. The same numbers tell different stories depending on how the viewer arrived.
Spikes, Trends, and the Illusion of Patterns
Another common mistake is overvaluing spikes in performance. A video that suddenly performs well can create the impression that a specific format or topic is the key to growth. Creators often try to replicate this success immediately, assuming they have found a pattern. But not all spikes indicate repeatable success. Some are driven by external factors such as timing, trends, or temporary search demand. When creators treat these spikes as a formula and attempt to replicate them without understanding the underlying cause, they often fail. This leads to confusion and frustration. Analytics should be used to identify consistent patterns, not one-time events. The goal is not to chase what worked once, but to understand what works repeatedly.
Why Timeframe Changes the Story
Data looks different depending on the timeframe you analyse. Short-term data highlights immediate reactions. It shows how a video performed in its early stages. Long-term data reveal stability. It shows whether a video continues to bring value over time. Many creators rely too heavily on short-term performance. They judge a video within a few days and make decisions based on early signals. While early data is useful, it does not always reflect long-term potential. A video that starts slowly can grow steadily through search. A video that spikes quickly can fade just as fast. Without looking at data across different timeframes, it becomes difficult to distinguish between temporary performance and sustainable growth.
The Real Purpose of Analytics
Analytics is not meant to validate your work. It is meant to guide it. The goal is not to confirm that a video did well or poorly. The goal is to understand why it behaved the way it did and what that means for future content. When analytics is used correctly, it reduces guesswork. It helps creators move from reacting emotionally to responding strategically. It provides clarity on what to improve, what to continue, and what to change. But this only happens when the data is interpreted correctly.
A Thought to Leave You With
YouTube Analytics is not complicated. It becomes complicated when the focus shifts from meaning to numbers. Views, CTR, retention, returning viewers, and traffic sources are not isolated indicators. They are part of a larger story about how viewers experience your content. When that story is read correctly, growth becomes more predictable. When it is misread, even good data leads to poor decisions. Because in the end, analytics is not about tracking performance. It is about understanding behaviour and using that understanding to improve what you create next.
If your analytics feel confusing, the issue is rarely the data itself. At Ping Network, we help creators interpret what the numbers actually mean and turn that into clear, actionable decisions for growth.
